If you are asked for the configuration files and / or trace files in a support case, you will find them in the following folder:
%ALLUSERSPROFILE%\Softing\PROFIBUS\Diag Suite\
This location may vary depending on the language and version of the Microsoft Windows operating system. e.g. C:\ProgramData\Softing\PROFIBUS\Diag Suite\
Please archive the complete folder and send it to support.automation@softing.com. This folder contains the configuration files, log files, and much more.
C:\ProgramData\Softing\PROFIBUS\Diag Suite\config
C:\ProgramData\Softing\PROFIBUS\Diag Suite\logs
...
If there are problems with a GSD file then please also send the following folder:
C:\ProgramData\Softing\PROFIBUS\gsd
Traces:
By default, only the exception logging is activated, which can be found in the program data directory at:
C:\ProgramData\Softing\PROFIBUS\Diag Suite\logs
In most cases, this information is sufficient to investigate.
However, in some cases, extended log files (application log files) are required.
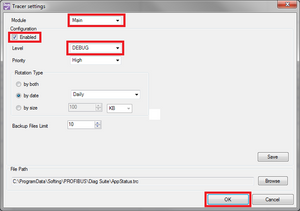
To enable application logging, you should also perform the following steps:
-
Open PDS
-
Press CTRL+SHIFT+T to open Tracer settings window
-
Select module “Main”
-
Check field “Enabled”
-
Change level to “DEBUG”
-
Rotation type can be kept in default “by date” and “Daily”
-
Click “Ok”

The application log files (AppStatus.trc) can be found at:
C:\ProgramData\Softing\PROFIBUS\Diag Suite\AppStatus.trc

